29 October 2010

Don’t waste my (users’) time

Tradeoffs are everywhere.  This is particularly true in the realm of software development.  As the saying goes, “speed costs.  How fast do you want to go?”  We should always keep these tradeoffs in mind as we balance our technology decisions with the needs of the business.

Here is a quick tale of a not-so-great performance optimization that really emphasizes the importance of making optimization decisions that actually have business value…

The case of a missed sort optimization
A business user and her colleagues currently sort and search a grid manually because "without some kind of 'sort' you have no idea where in the list your application will be found".  These results apparently get scrambled each time the grid refreshes.  The company is spending wage dollars (read “real money”) to do the work that the CPU could be doing for “free”.

In this case, the ten seconds worth of real money spent by the developer to type “ORDER BY ” would have been a huge win.  One ten-second real money line of code would have saved thousands of several-second real money live employee sorts. I don’t know about you, but I get excited about single order-of-magnitude performance increases.  This was a three-orders-of-magnitude oversight!

Because the developer didn't make this 10 second investment up front, the company now has two options (there may be others... conversations are good at flushing out options!):
1.    do nothing and continue to spend  real money to do the sorting that the CPU could be doing for free
2.    spend thousands of dollars of real money to add an ORDER BY (or an appropriate index to force a sort).

I can hear you scoffing now, “Sure, thousands of dollars!” Picture it with this nearly exaggerated process –

We start with our line-of-business employees spending their time (remember, that’s real money) adding the suggestion to the feature request system and voting it up (picture Microsoft Connect for your business applications).  We just spent more real money getting the bug typed in and voted up than we would have spent with the initial sort, but I digress.

Next, we have the bug validation team spending real money making the appropriate contacts and follow ups with a decision maker who determines (spending more real money) if this is a legitimate feature request.

Once we have determined that this is a real bug, worthy of company resources (more real money), we proceed to the team (think real money multiplied by Dilbert) that determines which features and applications get worked by which development teams and when.

Now that we’ve gotten all the way through the verification, validation, prioritization, and schedulization phase, it’s time for a software development team (there’s that real money multiplier again) to actually begin working the bug – remember that ORDER BY thing we were talking about?  Our software development team is going to go through its own verification, validation, prioritization and schedulization process.

They have to reproduce the bug, find the source code module where they can actually make the fix, fix it (our initial 10 second line of code), then run it though the test deployment process, user acceptance testing, the pre-prod deployment process, the pre-prod testing process, the change request for production process (think about another team here), the production deployment process and the post-production testing process.

Don't get me wrong, this isn't some process oriented bureaucracy, this is a kanbanagilescrum .NET development shop with all the modern efficiencies as their disposal.

You probably thought I forgot where I was going with this.  It was close there for a second, but it's still here.  The problem with this isn't that the developer made a simple oversight on a search screen and nobody noticed before production.  That’s understandable, and we all do similar things routinely.  The problem is that there really are developers who intentionally leave all of the sorting to the end-user because they want to save the CPU sort cost for the 400 rows.

These decisions not only erode our users’ confidence in both the development team and the application, they consciously make the tradeoff between CPU time and User time – and choose infinitesimally small bits of CPU time in favor of measurably large amounts of real money paid in the form of user time.

Stop wasting my users’ time!

10 September 2010

Alter Ego

So the other day I'm doing some light reading from Paul Randal about DBCC CHECKDB when I learn that, beginning with SQL 2005, CHECKDB actually performs its checks on an internal database snapshot and not the "real" database.  That was a totally unexpected bit of knowledge, so it really caught my eye.  It's great to have somebody that loves to share these things with the world.  Thanks, Paul!

A little more reading revealed that the internal database snapshot is implemented as an alternate stream of the live database file.  And also that I have no control over where it's created, so it can cause a nearly full drive to fill up during a CHECKDB (the original reason for his original article).

I had never heard of an alternate stream before, but I did find a couple pretty good explanations, that I won't cover here, other than to mention that it's a feature of NTFS and allows multiple data streams to be stored within a single file (the second link has downloadable source-code for utilities that manipulate alternate data streams, if you really want to get down in the weeds).

I wanted to see one of these alternate streams in action myself, and discovered that you can view a file's alternate streams by using the /R switch of the DIR command.  Here is DBCC CHECKDB in action, complete with a peek at the alternate steam in the file system.

I'm using the following command to provide directory listings for the  AdventureWorks database:


declare @cmd sysname
set @cmd = 'dir /R "C:\\AdventureWorks_Data*"'
exec master..xp_cmdshell @cmd


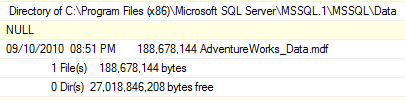
This shows the AdventureWorks_Data.mdf file:


Now run dbcc checkdb('AdventureWorks') and, while that is still running, kick off the DIR command from a separate SSMS window.  This shows the AdventureWorks_Data.mdf file and the alternate stream that is used for the internal database snapshot:


Notice that the DIR command only reported a single file in the summary.  The alternate data stream is completely invisible to most DOS style commands, and you'll never see one in Windows Explorer.

I didn't really expect to do so much digging after a little reading about DBCC CHECKDB, but it turns out there was a lot to learn, and I couldn't resist diving into the mysterious internal database snapshot and its alternate data stream.

Enjoy!

07 September 2010

Feeling the Love

DBAs @ Midnight just kicked off its second season. If, like me, you missed the live season opener, you'll have to settle for the preview until the recording is available.

In the meantime, they are forming a zombie gang and soliciting public displays of affection. I don't know if I'd make a good zombie gangster but I sure do enjoy the show, so here's my PDA:


Have a great second season Sean and Jen!

06 September 2010

That's Virtually Twice as Fast

We do much of our software testing and validation on virtual machines. We happen to be using VMWare ESX as the host and are testing with Windows XP SP3 as the guest.

We were getting pretty poor launch performance from our application as compared to a physical machine. I'll measure launch time in Task Manager Grid Squares (TMGS). Think of them like story points for performance monitoring. They just represent some arbitrary amount of time (what it is... 9 seconds per square?).

We have a main application, a supporting GIS application and a 3rd application for moving things around the network, and it was taking as many as 10 Task Manager grid squares for the three applications to launch. Here is what the launch sequence looks like in Task Manager:

Here is the key for the image:
1. Main application launch
2. GIS application launch -- almost 1 minute of 100% CPU -- OUCH!
3. Network search
4. Opening the first search result
To try and help out with the launch speed, we added a virtual processor and a virtual GB of RAM to the virtual machines. This reduced our launch time from 10 Task Manager grid squares to just over 6.


You can see that opening a search result wasn't really helped out because it is rather network intensive. Main application launch is a mix of network and processor, and didn't fare much better with two processors than it did before the upgrade.

The real benefit we saw was the large gain in both the launch of the GIS application and the processing of search results, both of which are processor intensive. We see the times here cut by more than half.

03 September 2010

Chew Once, Swallow Twice

I've been working on a legacy system that's been sitting on the shelf for about a year. Most of the system is in VB.Net, so I've been writing a fair amount of "VB#" as habit dictates that I end each line with a semi-colon -- it works in T-SQL and C#.

A workmate did find an import/export routine written in C#, and it had a great catch statement I thought I'd share. First it catches any error and swallows it, a la ON ERROR RESUME NEXT. But, just for good measure, it also checks the error message so it can execute... a comment!

catch (Exception ex)
{
if (ex.Message.Contains("Violation of PRIMARY KEY"))
{
//ok
}

}


I guess any data integrity error worth suppressing is worth over-suppressing. I've probably done the same type of thing a dozen times, so it's nice to have a little fun with somebody else's forgotten bit of error control.

01 September 2010

What's in a name?

The software team I've been working with had a “string or binary data would be truncated” error where we were trying to copy a 100 character “buyer name” column from one table into a 50 character column in another table. We also had a "seller name" column with the potential for the same error and fixed that one up, too.

I took a quick peek at the data to see how the name lengths were distributed in each table. Both names had an average length in the mid- to upper-teens. Virtually none of the names were longer than 50 characters (probably why the bug went unnoticed for years).

Here are a couple visuals of the distribution:


Since this was a reasonably large sample (more than 100,000 names in each column), it probably makes a good guideline for full name column sizing.

As is usual with software defects, the standard “we inherited it” rule applies in this case. Which brings up the quick unrelated observation that I rarely meet developers who claim to write bugs, just folks who inherit them. I'll have to write more on that, later.

At any rate, it seems that bug writers like myself are so prolific that it doesn't take very many of us to keep all the real developers busy.

16 February 2010

Are you a reader or a writer?

I stumbled across a query that gives the percentage reads versus writes and thought it might be interesting to see how some of my servers stack up.

I gave the query a couple tweaks so it returns percentage directly, as well as total reads and writes. I needed the totals so that I could calculate read and write percentages for a group of servers.

select
sum(user_seeks + user_scans + user_lookups) as total_reads,
sum(user_updates) as total_writes,
cast(
cast(sum(user_seeks + user_scans + user_lookups) as decimal) * 100.0
/
cast(Sum(user_updates) + sum(user_seeks + user_scans + user_lookups) as decimal)
as decimal(5, 2)) as read_percent,
cast(
cast(Sum(user_updates) as decimal) * 100
/
cast(Sum(user_updates) + sum(user_seeks + user_scans + user_lookups) as decimal)
as decimal(5, 2)) as write_percent
from
sys.dm_db_index_usage_stats


I recycled the original query from http://statisticsio.com/Home/tabid/36/articleType/ArticleView/articleId/324/Is-8020-a-90rsquos-Estimate.aspx

After running this as a multi-server query against a group of 12 instances, I put the query results into a spreadsheet so I could see how individual servers stacked up against the group.

There was quite a bit of variation, but all the instances had more reads than writes. The most read-skewed instance in the group did nearly 40 reads for each write, while the least read-skewed server only did 4 reads for every 3 writes.

As a group, these instances were reading over writing at a 5 to 1 ratio: the 80/20 rule we hear so much about is alive and well on these instances.

Instance

Reads

Read Pct

Writes

Write Pct

Read/Write Ratio

instance01

5,299,601

73%

1,961,846

27%

2.7:1

instance02

35,440,282

91%

3,570,652

9%

9.93:1

instance03

9,083,137

79%

2,475,755

21%

3.67:1

instance04

27,181,812

64%

15,568,632

36%

1.75:1

instance05

11,438,327

72%

4,384,756

28%

2.61:1

instance06

391,095,544

94%

27,148,899

6%

14.41:1

instance07

295,659,557

57%

220,249,874

43%

1.34:1

instance08

488,649,390

97%

13,016,100

3%

37.54:1

instance09

47,661,242

87%

6,896,585

13%

6.91:1

instance10

63,179,128

80%

15,418,897

20%

4.1:1

instance11

195,456,589

87%

28,239,952

13%

6.92:1

instance12

747,410,692

86%

123,282,598

14%

6.06:1

Group Totals

2,317,555,301

83%

462,214,546

17%

5.01:1